Manufacturing Defects - Data Analysis for Quality Control
Problem Statement
The manufacturing company wanted to improve product quality and reduce repair costs but lacked clear visibility into defect patterns. Specifically, they needed to identify:
Which defect types (structural, functional, cosmetic) contribute most to overall costs
Where defects are most frequently occurring (internal, component, or surface)
How effective different inspection methods are at detecting issues
Which severity levels (minor, moderate, critical) have the greatest impact on performance
Without these insights, the company risked rising repair costs, recurring quality issues, and missed opportunities to optimize inspection processes and improve product reliability.

Ask
Which defect types, locations, and severities are driving the highest repair costs, and how can quality inspection methods be optimized to reduce defects and costs?
Prepare
This dataset contains simulated data related to manufacturing defects observed during quality control processes. It includes information such as defect type, detection date, location within the product, severity level, inspection method used, and repair costs. This dataset can be used for analyzing defect patterns, improving quality control processes, and assessing the impact of defects on product quality and production costs.
Columns
Data set from Kaggle
🔗:https://www.kaggle.com/datasets/fahmidachowdhury/manufacturing-defects

Process
Cleaned the data in Excel:
Cleaned the data in Excel:
Removed duplicates and blank entries
Standardized date/time format
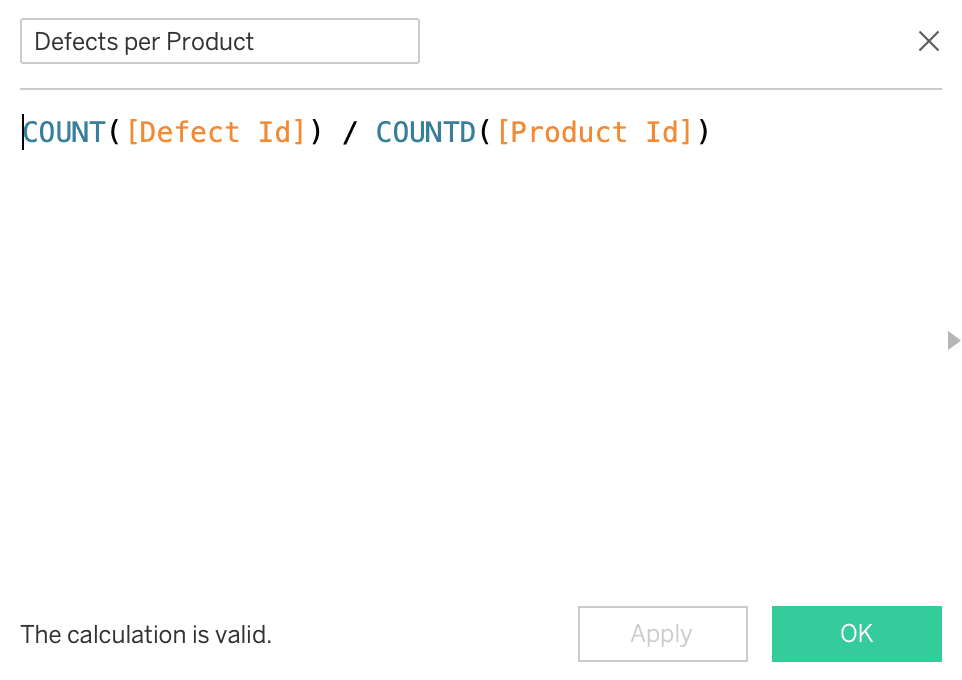
Created calculated fields:
Cumulative percent
Defects per product

Analyze
Total Defects: 1,000 → Repair Cost: $507,627.
Severity: 33% Critical, 31% Moderate, 36% Minor.
Defect Types: Structural (352), Functional (339), Cosmetic (309).
Pareto: 80% of issues driven by Structural + Functional defects.
Defect Locations: Surface (353) is the most affected area.
Inspection: Visual (351) and Manual (352) detect more than Automated (297).
Trends: Defects declining over time, but remain costly.


Act
Quality & Operations 🔧
Focus on reducing Structural & Functional defects (highest volume + cost impact).
Strengthen inspections at Surface locations, as they show the highest defect counts.
Inspection Methods 👀
Improve Automated Testing (lowest detection rate).
Reallocate inspection resources to balance manual, visual, and automated checks.
Cost Reduction 💰
Target defects with high repair cost but low frequency (Cosmetic in some cases).
Use the Pareto principle: prioritize the top 20% of defects driving 80% of cost.
Long-term Strategy 📈
Track defect severity trends monthly to see if improvements sustain.
Run root cause analysis on critical defects to prevent recurrence.